Graphing Linear Inequalities Worksheet: Mastering the Art of Graphical Solutions
In the world of mathematics, understanding linear inequalities is a fundamental skill that opens doors to a plethora of problem-solving opportunities. One of the best ways to grasp this concept effectively is by working on a "Graphing Linear Inequalities Worksheet." In this comprehensive guide, we will delve into the world of linear inequalities, offering you a step-by-step walkthrough on how to create and solve such worksheets. So, let's embark on this mathematical journey and equip ourselves with the knowledge to master graphing linear inequalities.
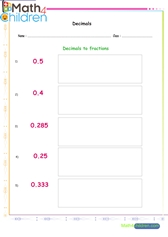
Converting decimals to fractions
Converting decimals to fractions printable math worksheet
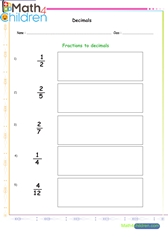
Converting fractions to decimals
Converting fractions to decimals printable math worksheet
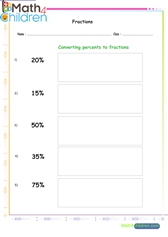
Converting fractions to percents
Converting fractions to percents printable math worksheet
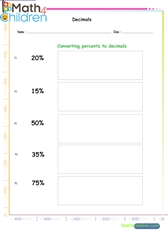
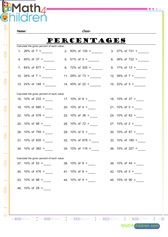
Converting percentage to decimals
Converting percentage to decimals printable math worksheet
Converting fractions to percents
Converting fractions to percents printable math worksheet
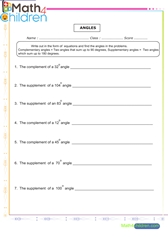
Complementary supplementary angles
Complementary supplementary angles printable math worksheet
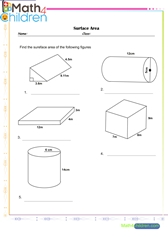
Surface area of complex figures
Surface area of complex figures printable math worksheet
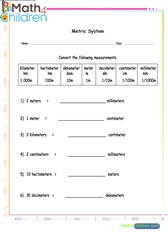
Metric system converting scales
Metric system converting scales printable math worksheet
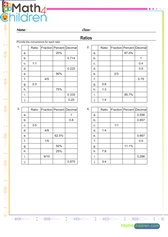
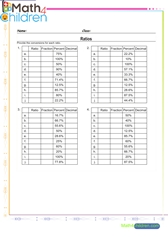
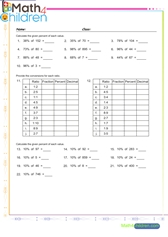
Ratio percent decimals fractions convertions
Ratio percent decimals fractions convertions printable math worksheet
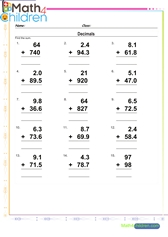
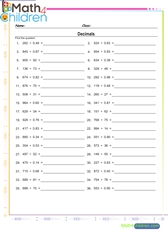
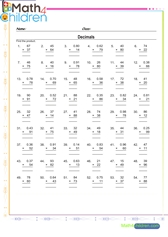
Pre algebra multiplication addition
Pre algebra multiplication addition printable math worksheet
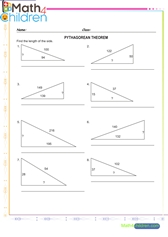
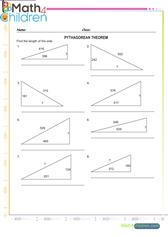
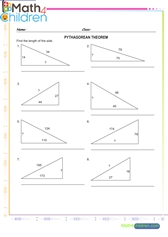
Triangle sides pythagorean theoream 6
Triangle sides pythagorean theoream 6 printable math worksheet
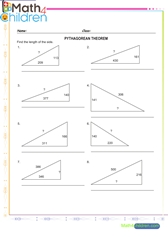
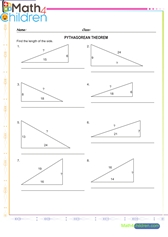
Triangle sides pythagorean theorem 1
Triangle sides pythagorean theorem 1 printable math worksheet
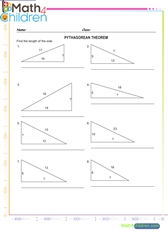
Triangle sides pythagorean theorem 2
Triangle sides pythagorean theorem 2 printable math worksheet
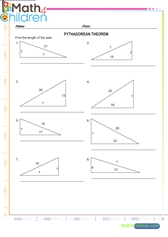
Triangle sides pythagorean theorem 3
Triangle sides pythagorean theorem 3 printable math worksheet
Triangle sides pythagorean theorem 4
Triangle sides pythagorean theorem 4 printable math worksheet
Triangle sides pythagorean theorem 5
Triangle sides pythagorean theorem 5 printable math worksheet
Triangle sides pythagorean theorem 7
Triangle sides pythagorean theorem 7 printable math worksheet
Introduction to Linear Inequalities
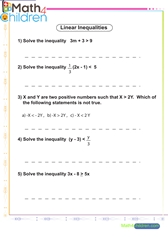
Linear inequalities are mathematical expressions that compare two algebraic expressions using inequality symbols such as <, >, ≤, or ≥. Solving these inequalities often involves graphing the solution set on a number line or the coordinate plane.
Components of a Linear Inequality
Understanding the components of a linear inequality is crucial. It consists of variables, constants, coefficients, and the inequality symbol. For example, in the inequality 2x + 3 < 7, 2x + 3 is the algebraic expression, and < denotes the inequality.
Graphing a Linear Inequality on a Number Line
To graph a linear inequality on a number line, we represent the solution set as a shaded region. For instance, if we have x < 4, we would shade the number line to the left of 4 to denote all values of x that satisfy the inequality.
Solving Linear Inequalities Algebraically
Algebraic methods are also used to solve linear inequalities. We manipulate the inequality to isolate the variable. Remember to reverse the inequality sign when multiplying or dividing by a negative number.
Graphing Linear Inequalities on the Coordinate Plane
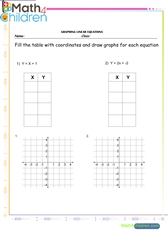
Graphing on the coordinate plane allows us to visualize solutions in two dimensions. We plot lines and shade regions based on the inequality's criteria.
Shading Regions on the Coordinate Plane
Understanding how to shade regions correctly on the coordinate plane is essential. Depending on the inequality, you will shade above or below the line.
Graphical Solutions to Real-World Problems
Linear inequalities find applications in real-life scenarios, such as budgeting, resource allocation, and business planning. We'll explore a practical example in this section.
Tips for Creating Effective Linear Inequality Worksheets
Crafting worksheets that effectively teach linear inequalities requires careful consideration of problem complexity, diversity, and clarity.
Common Mistakes to Avoid
Learn from common errors made when solving linear inequalities to prevent them in your own work.
Practice Makes Perfect: Sample Problems
Engage with a set of sample problems to apply your knowledge and reinforce your skills.
Benefits of Incorporating Worksheets in Learning
Discover the advantages of using worksheets as a teaching and learning tool for linear inequalities.
Challenges and How to Overcome Them
Explore the challenges students might face when dealing with linear inequalities and strategies to overcome them.
Conclusion: Mastering Linear Inequalities
As you journey through the world of linear inequalities, you'll find that mastering the art of graphing and solving them is both challenging and rewarding. Remember that practice, patience, and the right resources can make all the difference in your mathematical journey.
FAQs - Your Burning Questions Answered
FAQ 1: What is the significance of graphing linear inequalities?
Graphing linear inequalities helps visualize and understand the solution sets, making it easier to solve complex mathematical problems and tackle real-world scenarios.
FAQ 2: Can you provide an example of a real-world problem solved using linear inequalities?
Certainly! Consider a scenario where a company wants to maximize profits while minimizing production costs. Linear inequalities can be used to model this situation and find the optimal production levels.
FAQ 3: How can I ensure my linear inequality worksheets are effective for teaching and learning?
To create effective worksheets, focus on clear instructions, varied problem types, and gradual complexity. Ensure that students have access to solutions for self-assessment.
FAQ 4: Are there any online resources for practicing graphing linear inequalities?
Yes, many educational websites offer interactive tools and worksheets for practicing graphing linear inequalities. These resources can be valuable for both teachers and students.
FAQ 5: Is there any software or tool that can assist in creating linear inequality worksheets?
Several software applications and online tools are available for creating customized worksheets, making the process more efficient for educators.

